Review changes over several months
The revenue view shows revenue and expenses over the period displayed. An unusual month is easier to spot when you can see the trend. Then discuss the reasons with the people who know the work behind the figures.
In a team meeting, someone often says the last month went particularly well. A busy calendar may explain that impression. Whether revenue and expenses also changed is a separate question. With CleverHub analytics and reports, choose the time range, review the relevant figures, and decide together where to look more closely.
Book a demo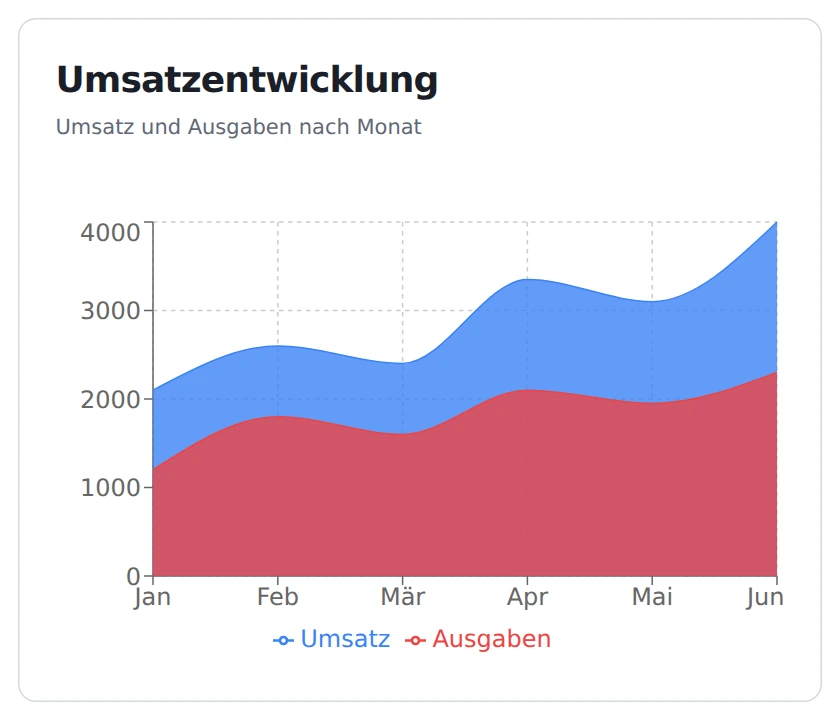
The revenue view shows revenue and expenses over the period displayed. An unusual month is easier to spot when you can see the trend. Then discuss the reasons with the people who know the work behind the figures.
Open the end-of-day report for a specific date. It gives your team a shared reference, for example after a long day of business. Decide what question you want the report to answer before interpreting individual numbers.
An appointment report helps when you discuss how busy the team was. It answers a different question from the revenue trend. Set a time range for the comparison and consider whether it includes any exceptional closures.
Choose as specific a question as possible for the next meeting. Do you want to understand the trend over several months or review a particular workday? That determines whether to open the analytics view or an individual report.
Set the time range or date in the relevant view. Review together what the report actually covers. When comparing two periods, make sure the team knows about any holidays or longer breaks within them.
Pick a month or day that stands out and describe the change in your own words. If it’s a payment question, open the relevant document next. Note who in the business can investigate the cause.
The chart plots both series over several months. Read the month labels and then the legend. Revenue and expenses can rise by different amounts. For a team meeting, ask a specific question, such as whether a large job was billed in a different month than originally planned.
In the reports area, request an end-of-day report for a selected date. That helps when a question concerns a clearly defined day. Agree on which date everyone should open. Someone looking at the previous day might otherwise have the same discussion using different figures.
Use the relevant report for a question about scheduling and check the start and end of the time range. One busy afternoon only tells you so much about the week. Discuss whether your team offered more appointment slots or lost a workday to training.
A fictional consulting office reviews the spring trend in its monthly meeting. Revenue rises in April while expenses rise by less. Management asks whether the team held more consultations or billed several finished projects in the same month. Either explanation could fit the initial observation.
The office checks appointment bookings for the period separately. A colleague then reviews the relevant invoices. The team can also open the end-of-day report for an individual consultation day with unusual figures. At the end of the meeting, it records what the documents already support and what still needs an answer.

Start with the revenue trend when the main question is how things changed over several months. Look at expenses on the same chart, then pick a specific case to follow up on.
Yes. Choose the date for the end-of-day report. This is useful for a handoff after an event or for following up on an appointment whose date you know.
Open the appointment report and set its date range. Bring the business calendar to the discussion as well so you can account for unusual opening days when interpreting the figures.
The line shows when a figure changed. Use the underlying records to understand why. A large payment and additional appointments, for example, can fall in different periods.
Bring a specific fictional observation. For example, one month might show higher revenue even though there were roughly as many appointments. Together we can try which report helps with the next check.